
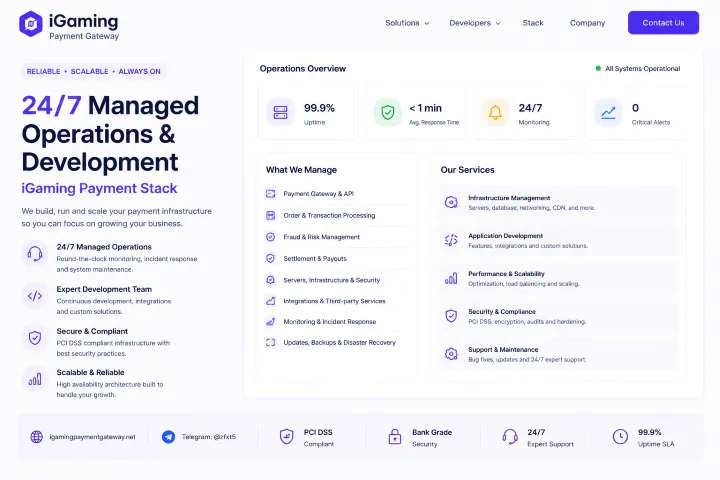
24/7 Managed Operations & Development | iGaming Payment Stack: The Rotation, the Runbook, and the Release Cadence Behind 'Always On'
24/7 managed operations and development for an iGaming payment stack is not a marketing phrase. It is a staffing rotation with named patterns, an incident severity ladder with named response times, a documented runbook for every recurring scenario, and a release cadence that ships features continuously rather than in scheduled quarterly bursts. This page describes how each of those pieces actually works — because "always on" without a documented structure is just hope.
Thousands of Indian players are tapping deposit. One of the local rails has just started showing elevated latency. The next 30 minutes decide whether your weekend revenue holds. This page is about who is awake during those 30 minutes, what they are doing, and how the same team also shipped the feature your operations lead asked for last Tuesday.
The Rotation — Follow-the-Sun Coverage, Documented
"24/7" means the work follows the sun. A rotation has named shifts, named regional alignment, and named handover windows. The shifts overlap deliberately so an incident in progress is never dropped between two engineers in different time zones. The illustrative shape:
The overlap windows are deliberate: shift A doesn't end until shift B is operational, with a structured handover that includes a stand-up review of open incidents, in-flight changes, and any rail-level health concerns to watch. An incident at 03:14 IST never crosses a "nobody is awake" gap, because somebody is always primary, and somebody else is always backup.
Incident Severity — Named Levels, Named Response Times
"We respond fast" is not an incident policy. A real one names the severities, defines them in unambiguous terms, and commits to time-bounded actions for each. The ladder we operate against:
| Severity | Definition & Example | Ack / Response | Comms |
|---|---|---|---|
| SEV-1 | Critical: cashier deposits failing region-wide, gateway unreachable, settlement halted. | acknowledge ≤ 5 min | customer-facing notice ≤ 15 min |
| SEV-2 | Major: one rail degraded but smart routing falling back; elevated decline rate on a specific method. | acknowledge ≤ 15 min | internal status update ≤ 30 min |
| SEV-3 | Minor: non-customer-impacting anomaly, individual tenant config issue, monitoring noise above threshold. | acknowledge same business hour | tenant ticket update |
| SEV-4 | Informational: background pattern worth reviewing, no immediate action required. | next standup | tracked in backlog |
"Acknowledge" is a specific act, not a vague intent: it means a named engineer has taken ownership of the incident, has begun the documented runbook for that scenario, and has updated the incident channel with their status. The customer-facing notice times above are commitments, not aspirations.
The First 30 Minutes of a Sev-1 — Documented
The scene at the top of this page — 03:14 IST, elevated rail latency — is exactly a Sev-2 or Sev-1 depending on impact. The first 30 minutes follow a documented sequence. The shape:
The Runbook Library — Not Tribal Knowledge
Operations maturity is most visible in whether incident response is "ask the senior engineer" or "open the runbook." A runbook is a written, tested, version-controlled document for a specific scenario, with named commands, expected outputs, and decision points. The library is large; the recurring entries:
runbook://rail-latency-spikerunbook://webhook-backlogrunbook://approval-rate-degradedrunbook://dns-cert-emergencyrunbook://fraud-clusterrunbook://recon-mismatchrunbook://deploy-rollbackPostmortem Template — Blameless, Structured, Public-Internally
A postmortem is not optional. Every Sev-1 produces one within 24 hours; every Sev-2 within 72. The template is structured so the document is comparable across incidents, which is what makes year-over-year trend analysis possible. The standard sections:
The Release Cadence — Continuous, Not Quarterly
Operations and development are the same team running in two modes — keeping the lights on and shipping the next thing. The release cadence is continuous: small, frequent, reversible releases rather than large infrequent ones. A typical week looks like this:
Hardening release
Low-risk improvements, observability tweaks, dependency updates.
Feature batch A
Smaller features ready for production. Staged rollout.
Tenant requests
Custom configuration changes batched for predictable deploy window.
Feature batch B
Second feature window; staged across regions.
Freeze begins
Non-emergency deploys halted ahead of the weekend peak window.
Peak operations
Active monitoring & standby capacity. Deploys only for incident response.
Peak continues
Coverage continues; postmortem prep for any weekend events.
Cycle restarts
Postmortem review; new week's hardening release prepares.
From Feature Request to Production — Named Stages
"Ongoing development" is meaningless without a named pipeline. A real one has stages, owners, and gates between them. The honest workflow from "operator asks for X" to "X is in production":
Where Ops Sits in the Bigger Picture
The operational rhythm described here is the human layer on top of the infrastructure described in our managed payment infrastructure article. The runbooks and incident response are operationalised through the same admin and audit tooling described in our merchant admin and order management back-end article. Operations isn't a separate department in a managed gateway — it's the discipline by which everything else stays usable.
Everything Else, Compressed
Scope of this article: The operational rhythm — rotation, severity ladder, runbook library, postmortem culture, release cadence, feature pipeline. The "how the 24/7 actually works" layer rather than the "what's running" layer.
What we provide: follow-the-sun primary + backup coverage, documented severity definitions with bound response times, a maintained runbook library, blameless postmortems within 24h of Sev-1, continuous deploy with weekend freeze, and a named workflow from operator request to shipped feature.
Pricing: Flat monthly hosting fee + 0.1–0.4% transaction volume share. 24/7 operations and ongoing development are included — not separately invoiced, not capped by ticket count.
Operations as engineering, not as a contact email address.
The rotation, runbook library, and release cadence behind 'always on' — visible, inspectable, accountable.
See How the Operations Run →Operations & Development Specific Questions
How is "primary on-call" different from "the engineer who answers when we email"?
Named, paged, documented. The primary on-call is a specific engineer for a specific window, with a specific paging path, a specific acknowledge SLO, and a named backup if they don't acknowledge in time. "Whoever responds to email" has none of those properties and isn't an on-call system.
What's your maintenance window policy?
Maintenance windows are never during peak Asian iGaming hours. Hardening releases happen Monday/Tuesday/Wednesday/Thursday in low-traffic windows; the Friday-through-Sunday window is freeze for non-emergency changes. Emergency changes during freeze require incident-commander approval and follow the same audit trail as a Sev response.
Do you provide a public status page?
Yes. A public status page with current state and incident history is provided. Tenants also receive structured incident notifications through documented channels (typically email + the admin dashboard) for incidents that affect their traffic.
How do you handle the difference between platform-wide and tenant-specific issues?
Severity classification accounts for blast radius. A Sev-1 affects multiple tenants or core infrastructure; a tenant-only impact starts as Sev-2 or Sev-3 depending on traffic concentration. Communication policy follows: platform-wide hits the public status page, tenant-specific stays in tenant channels.
Can my engineering lead see your incident process during evaluation?
Yes. We walk operations leads through the rotation, severity matrix, runbook list, and a redacted recent postmortem during evaluation. The point is that the process is inspectable; vendors who can't walk you through it are vendors whose process doesn't really exist.
Is there a feature-request limit per month?
No hard cap, but realistic prioritisation. Small per-tenant configuration changes are routine and ship in days. Platform-level features that need design and review are negotiated as roadmap items rather than treated as "one of N free per month."
What happens during a peak event we forgot to mention — say, a major cricket tournament?
The operations team tracks the regional sports calendar and stages additional standby capacity ahead of known peak windows whether the tenant explicitly flagged them or not. Surprise peaks are also handled by auto-scaling and on-call escalation; "we didn't know about it" is not a failure mode we want.
The Next Step
Working 24/7 managed operations and development for an iGaming payment stack is not a slogan you put on a contact page. It is a specific rotation, a specific severity ladder, a specific runbook library, a specific postmortem template, a specific release cadence, and a specific feature pipeline — each named, each documented, each inspectable. Operators evaluating gateways should walk through every one of those during evaluation; vendors who can't show them are vendors whose process exists only on the marketing page.
Tell us how your current operations team is structured, what your existing incident response looks like, and which peak windows in your business actually matter. We will walk through our rotation, runbook examples, and a recent postmortem with you — and your operations lead will form their own view of whether the 'always on' is real, not just announced.
The rotation that doesn't drop the page at 3 AM.
Operations as a discipline. Development as a habit. Neither as an afterthought.
Walk Through the Operations →